Skip to content

Leadbeater’s possum

Gymnobelideus leadbeateri

About

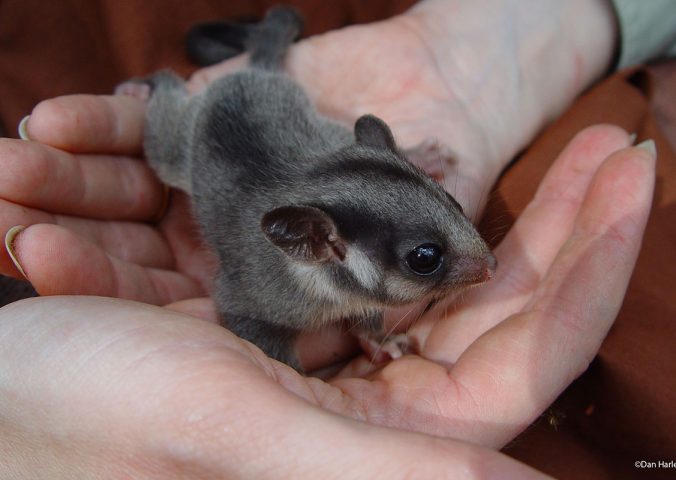
The Leadbeater’s possum was not sighted for 50 years and was thought to be extinct until its rediscovery in 1961.

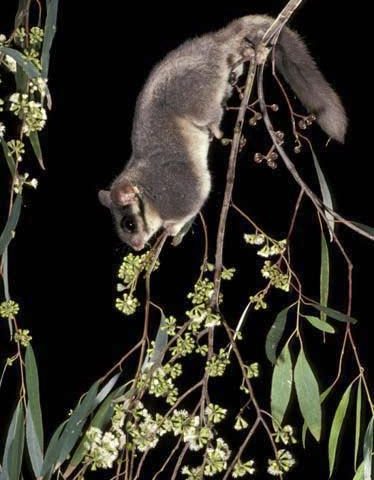
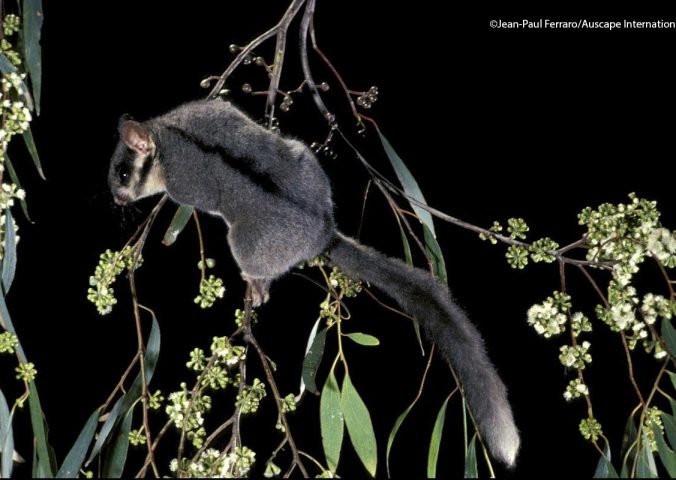
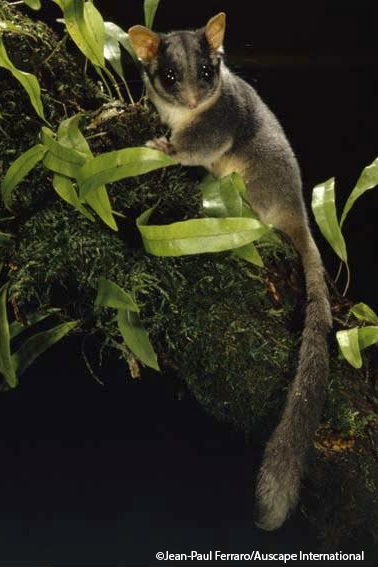
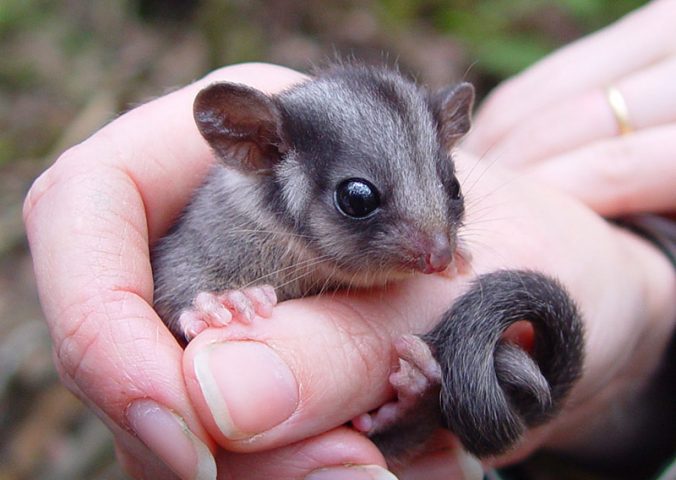
They are a nocturnal, arboreal species that spends its day in tree hollows. They require regenerating or uneven-aged Ash forest, meaning that they need a forest that is neither too young nor too old. They need this to have plenty of tree hollows to inhabit, and tree exudates to eat. However this habitat is under threat from wildfires and some timber harvesting practices. Its habitat is also closely tied to a narrow set of climatic conditions that could be severely affected by global warming.It is the only marsupial endemic to Victoria, and the only species in its genus, Gymnobelideus. There are three genera in its family, with 11 species, the genus Petaurus contains the wrist-winged gliders – which may be why the Leadbeater’s possum has vestigial gliding membranes.

  • Order: Diprotodontia
  • Family: Petauridae
  • Population: 2,000-11,250
  • Trend: decreasing
  • Size: 150-170mm
  • Weight: 110-165g

EDGE Score

EDGE Score: 19.85 (?)
ED Score: 21.56 (?)
GE / IUCN Red List (?)
Not Evaluated Data Deficient Least Concern Near Threatened Vulnerable Endangered Critically Endangered Extinct in the Wild Extinct

Distribution

Leadbeater’s possums’ are endemic to Australia, with a patchy distribution restricted to a 70 x 80 km area in Victorian Central Highlands at altitudes of 400-1,500m asl. There is also a small, isolated population inhabiting lowland swamp forests at Yellingbo, ~50 km east of Melbourne, Victoria.

Habitat and Ecology

Leadbeater’s possums’are found in three distinct forest types: tall, wet eucalypt forests, sub-alpine woodland, and lowland swamp forest. They need nest sites in living or dead old-growth trees and forages on eucalypts and wattles. They feed on sugary plant and insects exudates, such as saps, gum and honeydew, which are a good source of carbohydrates, as well as small invertebrates for protein.
Find out more

Conservation Actions

For each key category of conservation action, we calculated a conservation attention score based on expert information. In this graph, a higher score means the action is being carried out more intensively over more of the species range. The colour shows how important each action is considered to be for the conservation of this species.

Engaging stakeholders
89
Addressing threats
67
Status of knowledge
44
Management plan
56
Capacity building
89
Behaviour change
0
Awareness raising
78
Funding
78
Legislation
56
0
20
40
60
80
100
  Score: 100 means the activity occurs at high level across more than 75% of the species range
 
Priority:
High
Medium
Low
Very Low

Overall Conservation Attention

We combined all of the expert information on conservation actions to calculate an overall conservation attention score for this species. Please help us to reach our goal of establishing dedicated conservation attention at “High” levels for all EDGE species.

Very Low Low Medium High
75%

More information

Recent studies have grouped all possible conservation activities for any species into nine key categories (Washington et. al 2015). For each action, we asked experts for each species to assess the extent to which that action is being carried out and how much of the species’ range that action occurs in. For each action we used these two pieces of information to calculate the conservation attention score per action. A score of 100 means that the action is being carried out to a high level across at least 75% of the species range. We then combined the scores for all actions into an overall conservation attention score for the species. The experts also judged how important each category was to the conservation of that particular species.

This wordcloud illustrates the threats facing this species. The size of each word indicates the extent of a species range that is affected by that threat (larger size means a greater area is affected). The colour of the word indicates how much that threat impacts the species (darker shades of red mean the threat is more severe).

Habitat change Logging Fire Ecosystem changes

Threat wordcloud key:

Small area affected
a
a
a
a
a
a
a
Large area affected
Least severe
Most severe
Severity unknown
Source: The IUCN List of Threatened Species. Version 2017.1.
Available at: http://www.iucnredlist.org