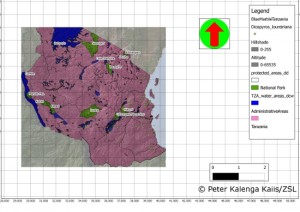
Most people have used a map. But how many people have created a map? This is one of the things that we are teaching the participants on the EDGE Conservation Tools training course. Peter Kalenga Kaiis tells us about creating his first map…
Two weeks in and now it’s real! This second week has been full of arithmetic, scientific theories and statistical knowledge. Raj kicked off by teaching us how to use QGIS: a computerised tool to display geographic data. It was really interesting to learn how to produce maps using different image layers and for the very first time I produced my own map, edited it and labelled it. Very cool!

We have also been learning a wide variety of statistical tools. This topic has not been easy and everyone has had to put in a lot of effort and concentration in order to understand the principles. To do this work, we’ve had the chance to use an advanced statistical software package called ‘R Studio’ as well as Excel and have used this software to produce histograms, box plots and line graphs.

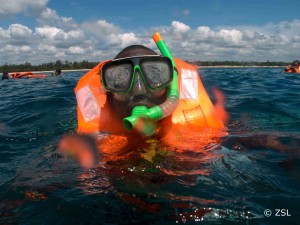
On Tuesday, we had a break from statistics and the whole group went snorkelling. Dave, who’s in charge of co-ordinating the marine activities during the course, took us to Msambweni turtle conservation group where we had two hours of fantastic snorkelling. I have hardly any experience in snorkelling so at first I was very nervous but Dave helped me and I was able to wear a lifejacket. Wow! Once I got over my fear, snorkelling was so much fun; viewing the beautiful corals and fish life in the ocean.
Late on Friday, we went for a game drive in Shimba Hills having first learnt about quantifying animal behaviour. The main aim of this trip was to observe and record the behaviour of a specific individual species using focal sampling. I manage to record this information for two species: warthogs and elephant. Back in camp, the data was compiled and displayed on a spreadsheet – the first step in creating an ethogram. That evening, I made a presentation about my lovely job with Camps International. Each of the participants are giving a presentation about their work.
I’m looking forward to learning more from ZSL. Indeed it has been a tremendous week….
The EDGE Conservation Tools training course forms part of the EDGE Fellowship programme – to learn more click HERE