About
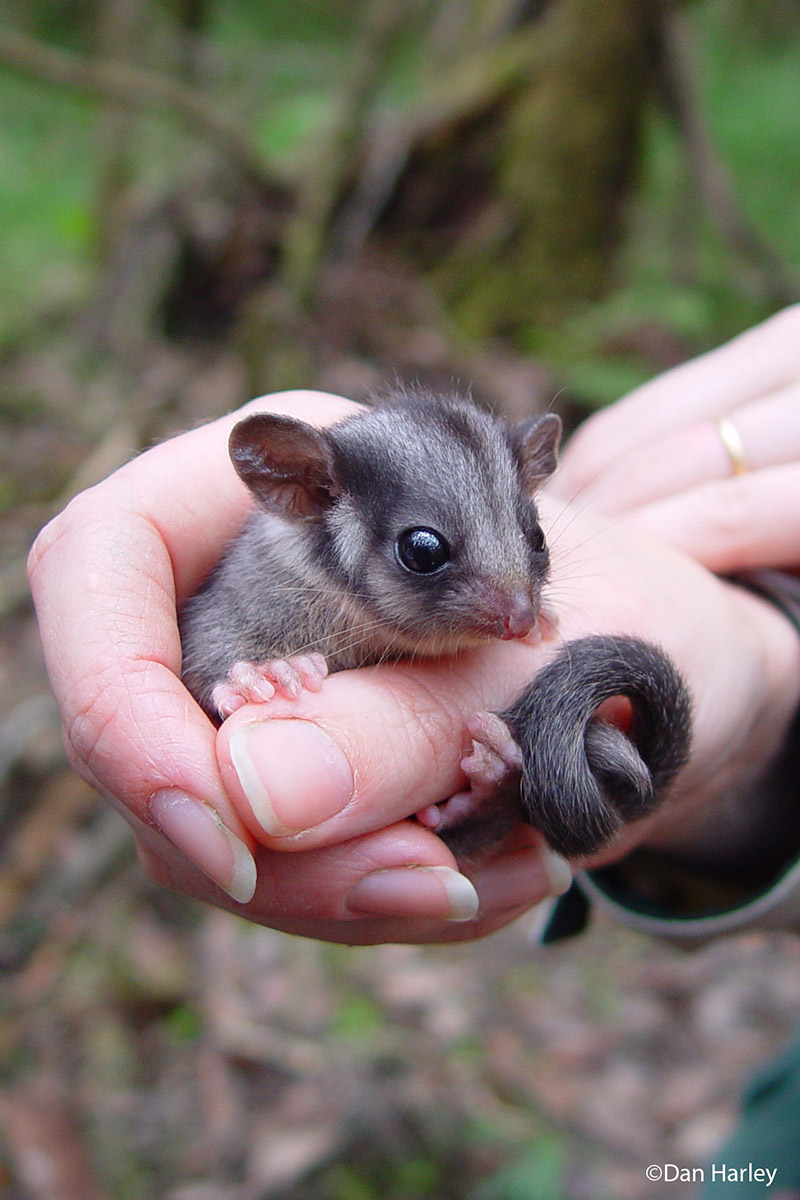
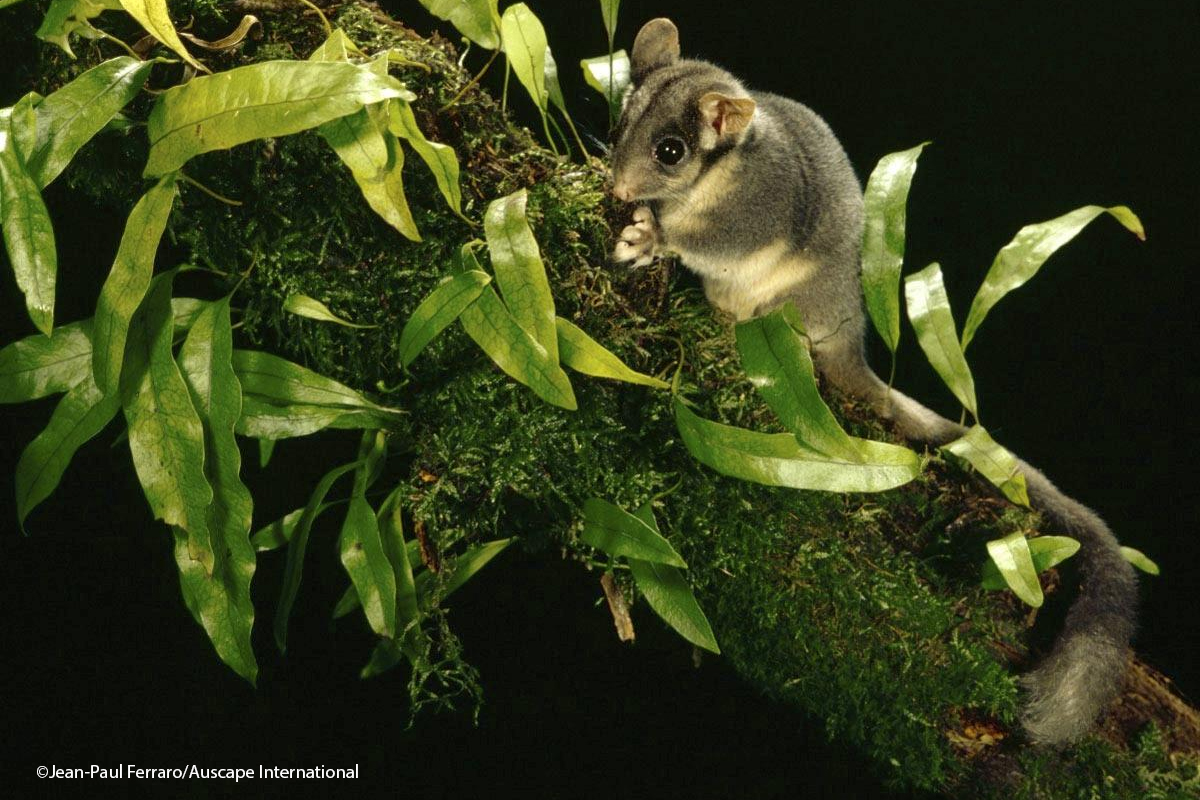
The Leadbeater’s possum was not sighted for 50 years and was thought to be extinct until its rediscovery in 1961.
They are a nocturnal, arboreal species that spends its day in tree hollows. They require regenerating or uneven-aged Ash forest, meaning that they need a forest that is neither too young nor too old. They need this to have plenty of tree hollows to inhabit, and tree exudates to eat. However this habitat is under threat from wildfires and some timber harvesting practices. Its habitat is also closely tied to a narrow set of climatic conditions that could be severely affected by global warming.It is the only marsupial endemic to Victoria, and the only species in its genus, Gymnobelideus. There are three genera in its family, with 11 species, the genus Petaurus contains the wrist-winged gliders – which may be why the Leadbeater’s possum has vestigial gliding membranes.
- Order: Diprotodontia
- Family: Petauridae
- Population: 2,000-11,250
- Trend: decreasing
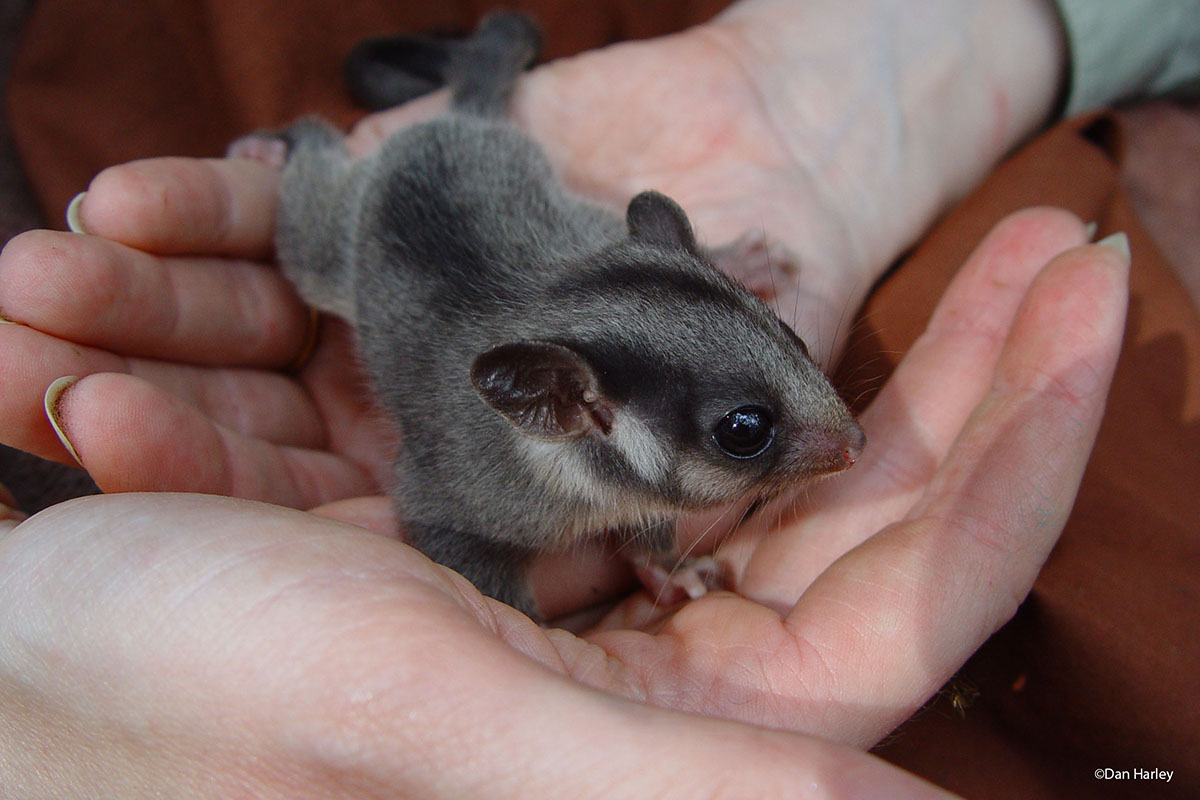
- Size: 150-170mm
- Weight: 110-165g
EDGE Score
Distribution
Leadbeater’s possums’ are endemic to Australia, with a patchy distribution restricted to a 70 x 80 km area in Victorian Central Highlands at altitudes of 400-1,500m asl. There is also a small, isolated population inhabiting lowland swamp forests at Yellingbo, ~50 km east of Melbourne, Victoria.
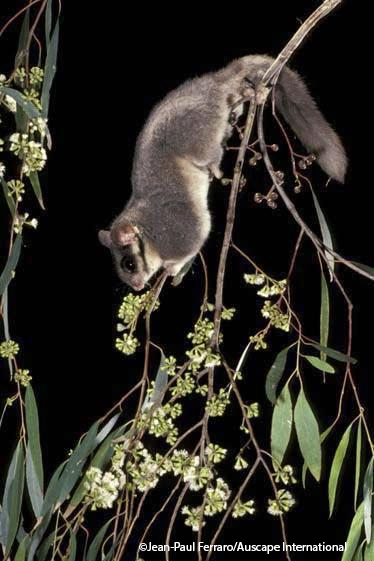
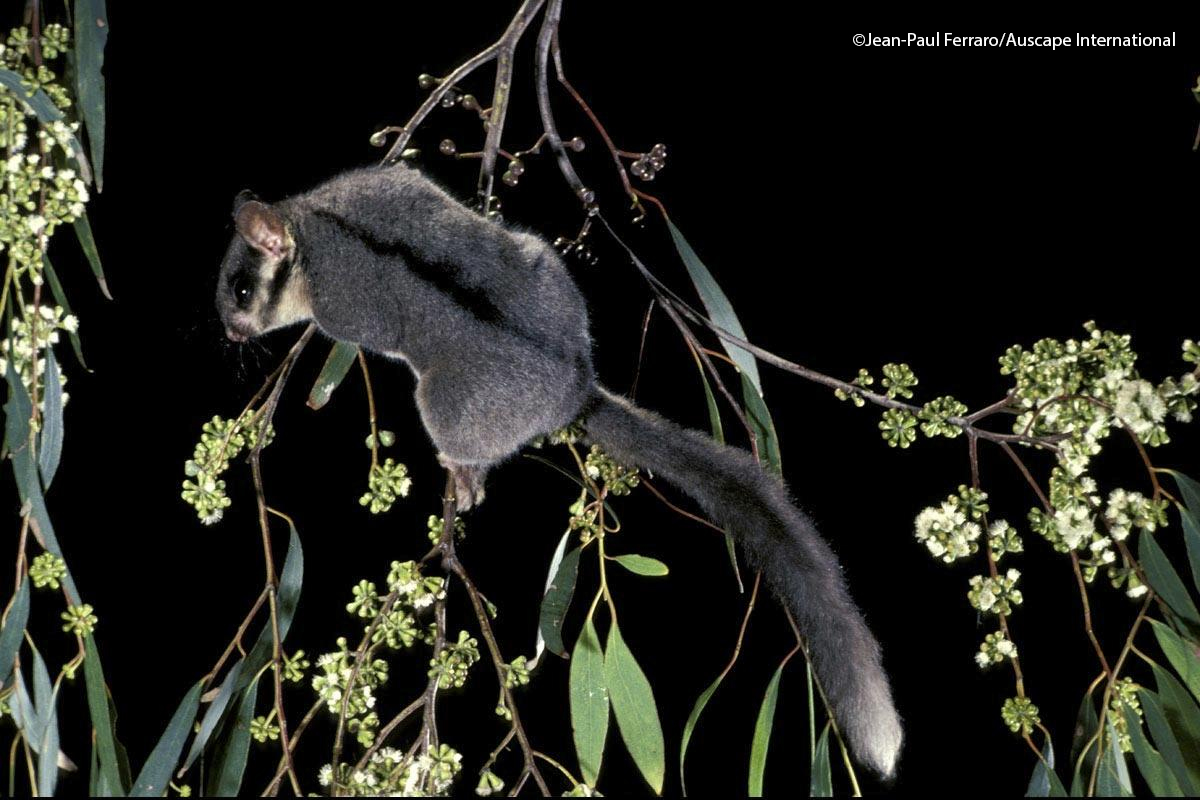
Habitat and Ecology
Leadbeater’s possums’are found in three distinct forest types: tall, wet eucalypt forests, sub-alpine woodland, and lowland swamp forest. They need nest sites in living or dead old-growth trees and forages on eucalypts and wattles. They feed on sugary plant and insects exudates, such as saps, gum and honeydew, which are a good source of carbohydrates, as well as small invertebrates for protein.


